5 Equities with Rising Dividend Payouts Are Going Ex-Dividend December 14, 2018
By: Ned Piplovic,
Income investors generally seek dividend-paying equities that offer increasing dividend payouts every year.
The five equities below are scheduled to go ex-dividend on December 14, 2018 and all have declared rising dividend payouts for their upcoming pay dates, which range between December 31, 2018 and January 15, 2019. The featured dividend stocks with rising payouts are:
Merck & Co, Inc. (NYSE:MRK)
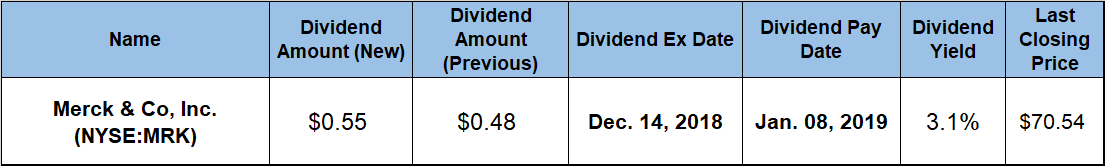
The company’s current $0.55 quarterly dividend is 14.6% above the $0.48 payout from the previous period, corresponding to a $2.20 annualized amount and yielding 2.8%. Merck’s current yield is more than four times higher than the 0.65% average dividend yield of the overall Health Care sector. Additionally, the current yield is 53% above the 1.82% simple average of the Major Drug Manufacturers industry segment, as well as 7.2% higher than the 2.6% average yield of the segment’s only dividend-paying companies. The company enhanced its total annual dividend amount by 45% over the past seven consecutive years, which is equivalent to a 5.4% average annual growth rate.
After a minor pullback to a 52-week low of $53.63 in early April 2018, the share price advanced nearly 50% before reaching its 52-week high of $79.34 on November 30, 2018. The $79.22 closing price on December 3, 2018, was 41% higher than one year earlier, 47.7% above the April low and 64% higher than it was five years ago. The dividend growth and asset appreciation combined to reward shareholders with total returns of 48%, 61% and 79% over the past one, three and five years, respectively.
DTE Energy Company (NYSE:DTE)
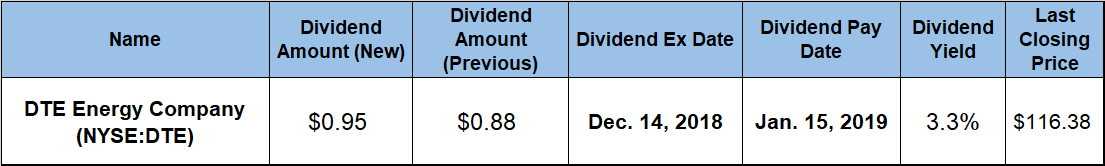
The company’s upcoming $0.945 quarterly distribution represents a 7.1% hike above the $0.8825 payout from the previous period, equaling a $3.78 annualized payout and yielding 3.2%. Over the past nine consecutive years, the company nearly tripled its total annual dividend amount by hiking its annual payouts at an average growth rate of 6.6% per year.
After declining 18% between December 2017 and the 52-week low of $94.70 on June 11, 2018, the share price reversed direction and started rising again. After the June low, the share price gained 26.7% before reaching its new all-time high of $119.95 on November 13, 2018. The December 3, 2018, closing price of $119.16 was 3.1% higher than one year earlier, 25.8% above the June low and nearly triple the price from five years ago. The total returns over the past one, three and five years were 7.5%, 62% and 104%, respectively.
Iron Mountain, Inc. (NYSE:IRM)
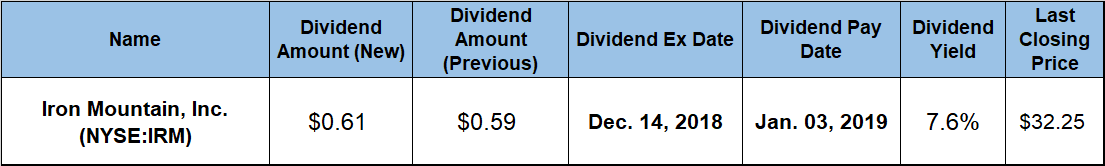
The company’s share price has experienced more volatility lately than during the 2008 financial crisis. However, the long-term share-price trend is to advance higher. Therefore, some investors might view the current pullback as a buying opportunity. The current share price has more than 10% room on the upside before it reaches the $39.40 analysts’ average target. After reaching its 52-week low of $30.48 on October 26, 2018, the share price has gained more than 11% to close on December 3, 2018, at $33.90. This closing price is 24% higher than it was five years earlier.
Iron Mountain’s current $0.611 quarterly amount is 4% higher than the $0.5875 distribution from the previous quarter. The new quarterly payout converts to a $2.444 annualized payout and yields 7.2%. This yield is nearly three-fold above the 1.93% average yield of the entire Services sector. Additionally, IRM’s current yield is also 365% higher than the 1.55% simple average yield of all the companies in the Business Services industry segment, as well as triple the 2.45% average yield of the segment’s only dividend-paying companies.
Since initiating dividend payouts in 2010, Iron Mountain enhanced its total annual amount 840%, which is equivalent to an average annual growth rate of more than 32%. The share price pullback imposed a total loss of nearly 10% over the past 12 months. However, if the share price follows trend and continues rising, shareholders might be back to enjoying robust gains like the 46% total return over the past three years or the 71% total return over the past five years.
Templeton Global Income Fund (NYSE:GIM)
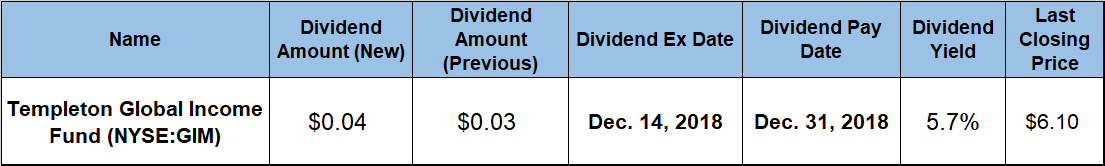
As of October 31, 2018, the Templeton Global Income Fund (NYSE:GIM) focused on global fixed income and had nearly $1 billion in total assets distributed across its holdings. Fixed income securities comprise more than 67% of the fund’s assets and the remainder sits in cash and cash equivalents. The fund’s highest exposure is to equities in Brazil (12.8%) and Mexico (12.1%). Along with equities in India (8.2%), Indonesia (7.5%) and the United States (6.5%), these top five countries account for nearly half of the fund’s assets.
The fund’s unit price has experienced several large swings since its inception in March 1988. With the current price near its all-time low from 2000, the high probability is that the unit price could extend its current uptrend after gaining 2.2% from its 52-week low of $5.99 on August 31, 2018 to close at December 3, 2018 at $6.12.
The fund’s total dividend payouts were insufficient to overcome the unit price decline and delivered a marginal total loss of 0.8% over the past 12 months. While the total five-year return is only slightly better at 1%, the total return over the past three years was nearly 10%.
The fund’s current $0.0378 monthly distribution is nearly 22% higher than the $0.031 payout from the previous month. This upcoming payout amount is also the second highest of all monthly dividend payouts since August 2012 and corresponds to a total annual payout of $0.4536, which converts to a 7.4% forward yield. This yield is 137% higher than the 3.12% average yield of the overall Financials sector. Additionally, the fund’s current 7.4% yield is nearly double the 3.85% average yield of all the companies in the Debt Closed-End Funds industry segment, as well as 20% above the 6.17% simple average of the fund’s only dividend-paying equities.
Saratoga Investment Corporation (NYSE:SAR)
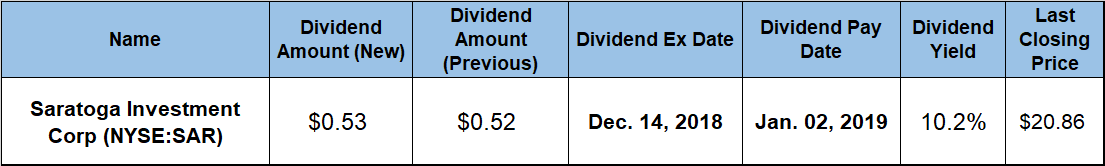
The company’s share price faced a fair amount of volatility over the past year. After an initial decline between December 2017 and mid-February 2018, the share price reversed direction and then spiked to its highest level in nearly a decade by late June. However, after that spike, the share price surrendered all its gains and ended the trailing 12 months with a marginal gain.
The share price bottomed out at $19.90 in mid-February and then gained nearly 40% before reaching the $27.74 high on June 26, 2018. After giving up all those gains, the share price closed on December 3, 2018, at $22.83. This closing price was just 1.5% higher than one year earlier, 15.3% above the February low and nearly 50% higher than it was five years ago.
The company has hiked its dividend payouts over the past 17 consecutive quarters. The upcoming $0.53 quarterly amount is nearly 2% above the $0.52 payout from the previous period and 8.2% higher than the $0.49 quarterly payout from the last period 2017. The streak of rising dividend payouts for 17 consecutive quarters nearly tripled the company’s total annual dividend payout, which corresponds to an average growth rate of 6.6% per quarter, or 31% per year.
Despite the flat share price, the company delivered to its shareholders a total return of more than 10% over the past year, as well as total returns of 81% and 96% over the past three and five years, respectively.
Dividend increases and dividend decreases, new dividend announcements, dividend suspensions and other dividend changes occur daily. To make sure you don’t miss any important announcements, sign up for our E-mail Alerts. Let us do the hard work of gathering the data and sending the relevant information directly to your inbox.
In addition to E-mail Alerts, you will have access to our powerful dividend research tools. Take a quick video tour of the tools suite.

Related Posts:


Ned Piplovic
 Connect with Ned Piplovic