REIT and Income Fund Provides 7% Yield and 6% One-Year Asset Appreciation
By: Ned Piplovic,

The Cohen & Steers REIT & Preferred Income Fund, Inc. (NYSE:RNP) is rewarding its shareholders with a 7% dividend yield and asset appreciation that came in at almost 6% for the last 12 months.
The high dividend yield and moderate asset growth combination paid investors a total return of more than 14.2% since early October 2016 and even higher total returns of 49.7% and 63.5% over the past three and five years, respectively.
The fund has an ex-dividend date of October 23, 2017, with the pay dates following a week later, on October 31, 2017.
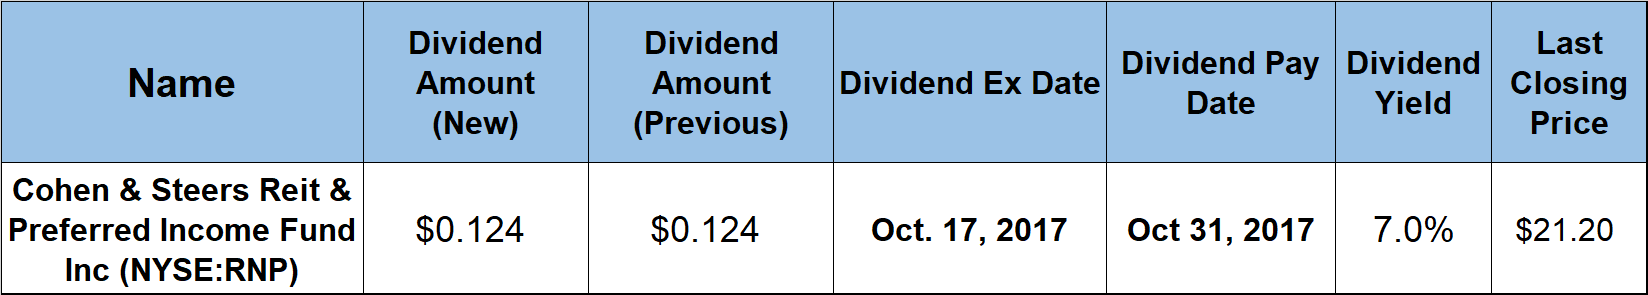
Cohen & Steers REIT & Preferred Income Fund Inc (NYSE:RNP)
Cohen & Steers REIT and Preferred Income Fund is a closed-end fund with a primary investment objective of high current income through investment in real estate and diversified preferred securities.
Real estate securities include securities of any market capitalization issued by real estate companies – such as real estate investment trusts (REITs) – and preferred securities issued by U.S. and non-U.S. companies. The fund’s $1.4 billion of assets under management were spread across nearly 200 individual holdings as of August 31, 2017.
As of June 30, 2017, the fund’s top five holdings and their respective percentages were Simon Property Group Inc. (NYSE:SPG), 3.1%; Prologis Inc. (NYSE:PLD), 2.6%; Equinix Inc. (NASDQ:EQIX), 2.5%; Equity Residential (NYSE: EQR), 2.2%; and Essex Property Trust, Inc. (NYSE:ESS), 2%. Each of the remaining holdings in the fund accounted for a 1.9% share or less.
Apartments and office securities – representing 20% and 16% of the fund’s assets, respectively – were the top two sectors represented among REIT holdings. Among the non-REIT holdings, banking accounted for a 50% share of total assets. Insurance holdings accounted for an additional 16% share. Utility, real estate and securities classified as other each accounted for almost 8% of the fund’s holdings.
The fund’s current $1.488 annual payout is distributed in $0.124 monthly payments and converts to a 7.0% yield .
This current yield is about 6% lower than the funds 7.5% average yield over the past five years. However, while the dividend distributions continue to rise, the current yield has been suppressed by the record-high share price levels.
After starting to pay a dividend in 2003, the fund initially quadrupled its annual dividend in just four years. However, starting in 2007, the company cut its annual payout three years in a row. The fund boosted its dividend slightly in 2010 and then distributed a flat $1.20 dividend every year from 2011 to 2013. In 2014, the fund resumed raising its dividend and has hiked its annual distribution for the past four years. Since 2014, the annual dividend amount rose at an average annual rate of 5.5%. However, since the most recent dividend cut in 2009, the annual dividend grew at an average rate of 7.4% per year and has almost doubled in eight years.
The share price reached its 52-week low of $17.91 in mid-November 2016, after it dropped 10.5% over the previous weeks. Fortunately for the fund’s investors, the share price reversed trend in the second half of November 2016 and has been rising since then with only two noticeable drops. Since the November low, the share price climbed almost 20% in less than 10 months to reach its 52-week high of $21.47 during trading on September 20, 2017. The share price closed on October 2, 2017, at $21.20, which is almost 6% higher than it was 12 months ago.
The share price’s 50-day moving average (MA) crossed below the 200-day MA in mid-November 2016, at the same time when the share price hit its 52-week low. The average continued to fall through the end of 2016 and a couple of weeks into 2017. In the second week of January 2017, the 50-day MA reversed trend and began climbing. By mid-May 2017, the 50-day MA crossed above the 200-day MA and continues to climb. Even as the 200-day MA started to rise at a faster pace in July 2017, the 50-day MA remains about 4% above the 200-day MA.
While the 6% asset appreciation is lower than some other funds in the sector, some of the technical indicators for RNP, such as the moving averages, suggest that the share price could continue to ascend a little longer.
Dividend increases, dividend decreases, new dividend announcements, dividend suspensions and other dividend changes occur daily. To make sure you don’t miss any important announcements, sign up for our E-mail Alerts. Let us do the hard work of gathering the data and sending the relevant information directly to your inbox.
In addition to E-mail Alerts, you will have access to our powerful dividend research tools. Take a quick video tour of the tools suite.

Related Posts:


Ned Piplovic
 Connect with Ned Piplovic