The Dividend Stocks That Doubled Their Price in 2021
By: Jonathan Wolfgram,
Dividend stocks that have doubled in price during 2021 include a number of traditionally conservative investments, rather than just high-growth, high-risk equities.
There also exist hundreds of volatile dividend-paying companies with aggressive growth strategies. Although many of these companies failed in their growth attempts — or at least didn’t achieve the absurd triple-digit-percentage returns this list is heralding — others went sky-high.
Every equity on this list both pays a regular dividend and has achieved greater than 100% returns in 2021 so far this year. Before adjusting for dividend income, the average growth among these dividend stocks is 143.1% year to date (YTD) and the highest growth was achieved by SM Energy (NYSE:SM) — 284.2%. Yes, all of this was achieved year to date, or in roughly the last 6 months.
Charted below is the average growth YTD of these 31 dividend stocks against the S&P 500. An equal position in each of these taken on January 1, 2021, would have returned 173.2% after adjusting for dividends, compared to the S&P 500 rising 12.7% over the same amount of time.
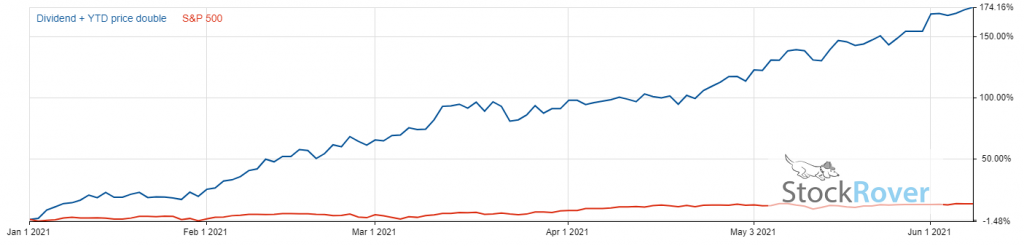 Chart provided by StockRover, start your free trial here.
Such fast growth, however, does not necessarily make these equities a smart investment. Some of them may demonstrate an upward trend and continue their extraordinary growth. Others may have grown too fast to support themselves and might head for a crash in the near future, while others have likely been overbought by investors to drive the price much higher than the actual company value.
Recharting the 31 dividend stocks that doubled their price with Bollinger Bands gives us a rough idea of the volatility. Bollinger bands are a measure of volatility based on simple moving averages and changing market conditions. The closer the price is to the upper limit, the more overbought the market, and the closer the price is to the lower limit, the more oversold the market.
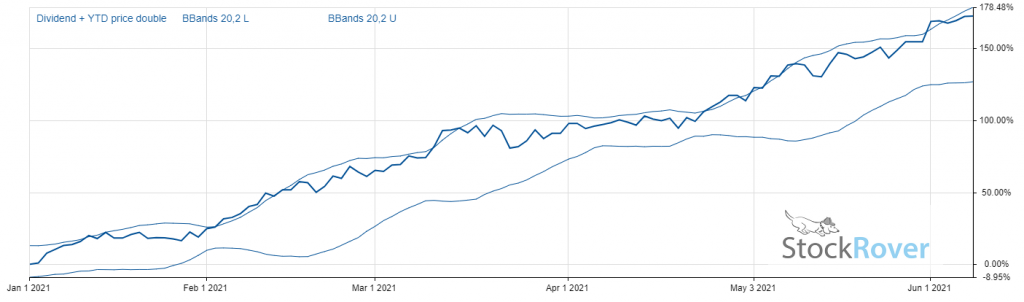 Chart provided by StockRover, start your free trial here.
The average stock on our list stays near the upper band almost continually, indicating a high amount of risk in the equities shown below. Of course, these are averages, and there will be outliers included that are both far less volatile than the typical stock on this list or far more volatile. We encourage investors to exercise caution and do their due diligence by researching any equities before buying and trading them — since just because a stock has gone up in the past does not mean it will continue to do so.
Investors may also see the high-growth dividend stocks on this list as possible targets for a short strategy, anticipating many of them to drop in price in the near future. Once again, please do your research and exercise caution when trading any contracts surrounding high-volatility equities.
In ascending order of their YTD returns, here is the complete list of dividend stocks that doubled their price in 2021.
| Ticker | Sector | Consecutive Annual Dividend Hikes | Market Cap | Latest Close Price | Projected 12 Month Dividend Yield | Trailing 12 Month Dividend Yield |
|---|---|---|---|---|---|---|
| PTEN | Energy | 2 | $4.62B | $11.33 | 2.82% | 2.82% |
| MRO | Energy | 3 | $15.98B | $27.68 | 1.59% | 1.52% |
| SKT | Financials | 0 | $2.88B | $26.48 | 4.15% | 0.98% |
| NUE | Materials | 14 | $46.41B | $192.78 | 1.12% | 1.09% |
| CBD | Services | 0 | $0 | $0.46 | 19.61% | N/A |
| TIPT | Financials | 1 | $585.24M | $15.92 | 1.51% | 1.32% |
| TPL | Financials | 0 | $13.46B | $584.96 | 2.39% | 2.27% |
| SJT | Financials | 0 | $223.26M | $4.79 | 8.77% | 8.85% |
| OVV | Energy | 3 | $13.95B | $51.75 | 2.32% | 2.32% |
| CLR | 0 | $26.96B | $74.27 | 0.00% | 1.33% | |
| DCOM | Financials | 1 | $699.27M | $18.01 | 5.55% | 5.55% |
| NOG | Energy | 2 | $4.28B | $42.45 | 3.77% | 3.65% |
| REVG | Consumer Products | 0 | $1.10B | $21.24 | 0.94% | 15.07% |
| PDCE | 0 | $6.46B | $73.85 | 0.00% | 2.91% | |
| ERF | Energy | 3 | $4.14B | $20.05 | Currency Mismatch | Currency Mismatch |
| GOGL | Industrials | 0 | $1.87B | $13.06 | 4.59% | 4.59% |
| SBLK | Industrials | 0 | $2.24B | $23.02 | 6.17% | 6.17% |
| GNK | Industrials | 0 | $861.84M | $20.26 | 8.09% | 4.24% |
| OMP | 0 | $1.16B | $23.86 | 0.00% | 9.26% | |
| NMM | 1 | $199.01M | $42.02 | 0.48% | 0.59% | |
| OAS | Energy | 0 | $2.15B | $109.30 | 0.00% | N/A |
| ZEUS | Materials | 2 | $760.83M | $68.34 | 0.88% | 0.77% |
| MTDR | Energy | 2 | $7.85B | $65.65 | 1.22% | 1.07% |
| DDS | Services | 1 | $5.07B | $407.52 | 0.25% | 5.14% |
| REPX | Energy | 2 | $576.71M | $28.27 | 5.09% | 4.95% |
| TGLS | Materials | 3 | $2.69B | $57.15 | 0.77% | 0.66% |
| BGFV | Services | 0 | $69.79M | $3.11 | 6.43% | 21.70% |
| DAC | Industrials | 2 | $1.47B | $72.07 | 4.44% | 4.30% |
| FINV | Financials | 3 | $876.70M | $4.68 | 4.27% | 4.64% |
| SM | Energy | 2 | $5.71B | $49.29 | 0.73% | 1.28% |
.stocks-table th {
background-color: #128631;
color: white;
text-align: left;
vertical-align: bottom;
padding: 5px;
}
.stocks-table td {
text-align: left;
vertical-align: bottom;
padding: 5px;
}
.stocks-table tr:nth-child(odd) td {
background: #85efa138;
}
.stocks-table th.right, .stocks-table td.right {
text-align: center;
}
Related Articles:
3 Best Dividend Stocks to Buy Now
3 Dividend Growth Stocks to Buy Now
Top 10 Best Screening Tools for Investors
25 High Dividend Stocks in 2020 to Consider Buying
10 High Dividend Stocks Under $20
Dividend increases and dividend decreases, new dividend announcements, dividend suspensions and other dividend changes occur daily. To make sure you don’t miss any important announcements, sign up for our E-mail Alerts. Let us do the hard work of gathering the data and sending the relevant information directly to your inbox.
In addition to E-mail Alerts, you will have access to our powerful dividend research tools. Take a quick video tour of the tools suite.
Related Posts:


Jonathan Wolfgram
 Connect with Jonathan Wolfgram